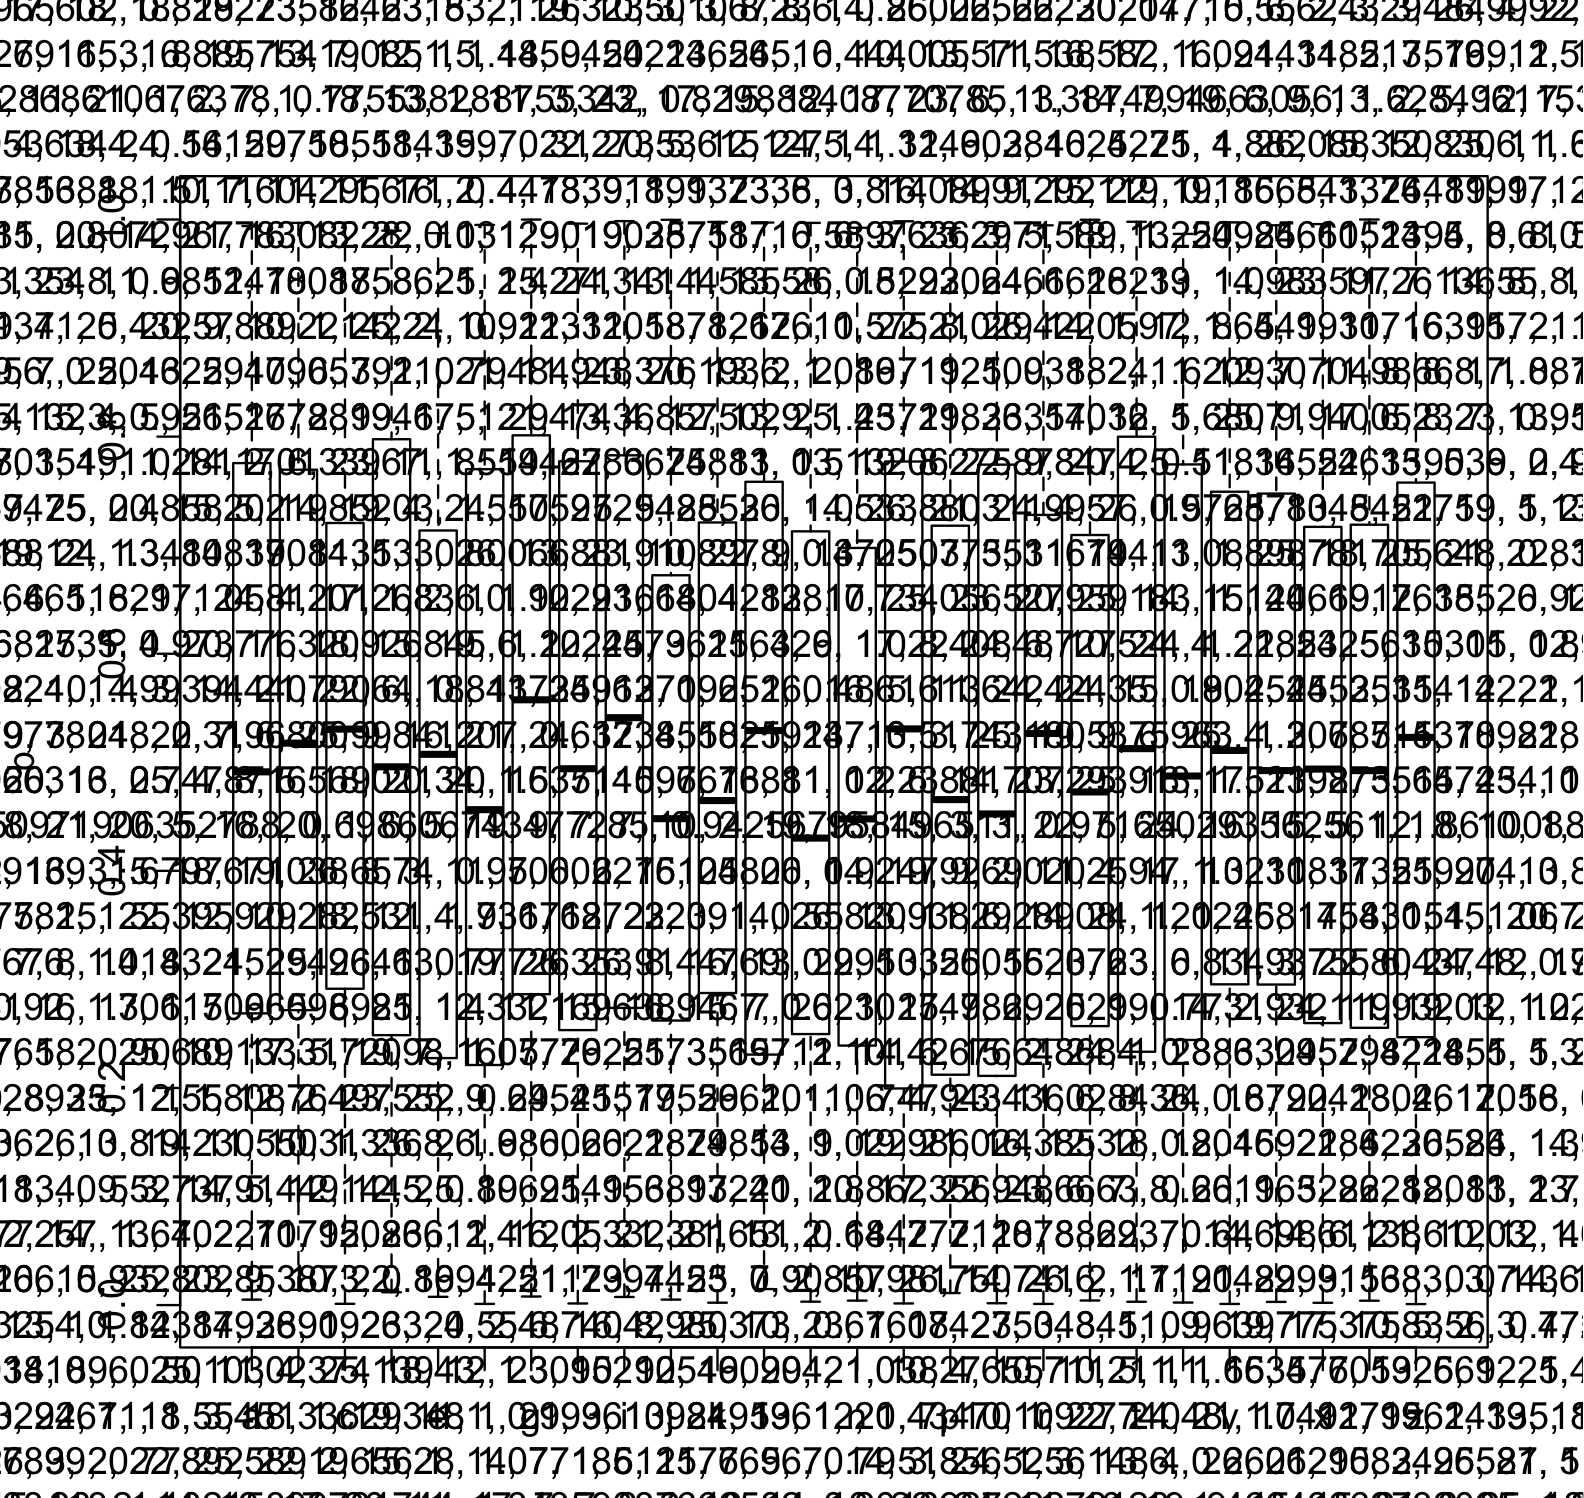
I learned a new thing about R!
I did not know R would do that.
I did not want R to do that. #rstats #oops pic.twitter.com/0ySMC7ZCyy— Sarah Goslee (@numberwright) February 28, 2018
That is not at all what I’d intended. I wanted to compare two related datasets, each a column in a separate data frame.
Here’s a reproducible example.
Plotting blooper
# fake data
dat1 <- data.frame(a = sample(letters, 5000, replace=TRUE), b=runif(5000))
dat2 <- data.frame(a = dat1$a, b=(dat1$b+runif(5000)))
# what I meant
plot(dat1$b, dat2$b)
# what I actually typed
plot(dat1, dat2)
